Analyzing website traffic using Google Analytics is crucial for understanding user behavior, optimizing online marketing efforts, and improving overall website performance. Google Analytics provides a wealth of data that, when properly interpreted, can inform key decisions about content strategy, user experience design, and conversion optimization. This guide will provide a comprehensive overview of how to effectively analyze your website traffic using this powerful platform, empowering you to make data-driven decisions that drive real results for your business in 2026. This guide will help you navigate data, understand key metrics, and transform insights into actionable improvements.
Setting Up Google Analytics

Before you can begin analyzing your website traffic, you need to properly set up Google Analytics. This involves creating an account, adding your website, and implementing the tracking code on every page of your site. It is very important to ensure accurate data collection begins from the moment someone visits your website. Verification of the tracking code is essential to ensure it is collecting data correctly, by visiting your website and checking real-time reports.
Proper configuration also means setting up goals and conversions, which are specific actions you want users to take on your site, such as submitting a form, making a purchase, or downloading a resource. Defining these goals allows Google Analytics to track the success of your marketing campaigns and website optimization efforts. By understanding what actions you want users to take you will be able to better leverage Google Analytics data.
Understanding Key Google Analytics Metrics
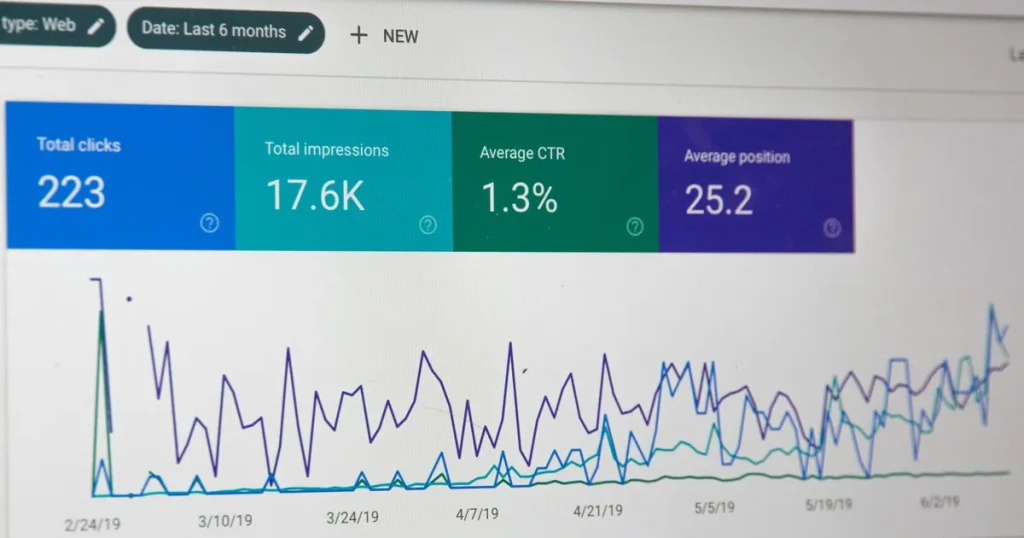
Google Analytics provides numerous metrics, but some are more important than others for understanding your website traffic. These include users, sessions, bounce rate, session duration, and page views. Users represent the number of unique visitors to your site, while sessions are the total number of visits. Bounce rate measures the percentage of visitors who leave your site after viewing only one page, with a lower bounce rate typically indicating higher engagement.
Session duration refers to the average amount of time visitors spend on your site during a session, and page views measure the total number of pages viewed. By monitoring these metrics over time, you can identify trends, spot potential problems, and assess the impact of your website optimization efforts. Reviewing these metrics daily will help identify opportunities to improve user experience and drive engagement.
Segmenting Your Audience
A crucial aspect of effective analysis is segmenting your audience. Google Analytics allows you to divide your website visitors into different groups based on characteristics such as demographics, location, device, and behavior. By segmenting your audience, you can gain a deeper understanding of how different groups of people interact with your site and tailor your marketing efforts accordingly. For example, you might discover that mobile users have a higher bounce rate than desktop users, indicating a need to optimize your site for mobile devices.
Analyzing Acquisition Channels
Understanding where your website traffic is coming from is essential for optimizing your marketing budget. Google Analytics provides detailed information about your acquisition channels, including organic search, paid search, social media, referral traffic, and direct traffic. Analyzing these channels allows you to identify which sources are driving the most valuable traffic to your site and allocate your resources accordingly.
For example, if you find that organic search is a major source of traffic, you might invest more in SEO to improve your rankings in search results. Alternatively, if paid search is driving high-converting traffic, you might increase your advertising budget. Understanding these acquisition channels will help you make informed decisions about where to invest for your marketing and advertising efforts during 2026.
Evaluating Content Performance

Evaluating your website’s content performance is vital for improving user engagement and driving conversions. Google Analytics allows you to track the performance of individual pages, blog posts, and other content assets. By analyzing metrics such as page views, time on page, and bounce rate, you can identify which content is resonating with your audience and which content needs improvement.
You can also use Google Analytics to track the performance of specific content types, such as videos, infographics, and interactive tools. By understanding what types of content your audience finds most engaging, you can create more of what works and improve the overall user experience. Using these insights to refine your content strategy will maximize engagement and drive results based on your goals.
Tracking Conversions and Goals
Tracking conversions and goals is essential for measuring the success of your website and marketing campaigns. Google Analytics allows you to define specific goals, such as form submissions, purchases, or downloads, and track the number of users who complete those goals. By monitoring your conversion rates, you can identify areas for improvement and optimize your website to drive more conversions.
You can also use Google Analytics to track the value of each conversion, allowing you to calculate your return on investment for different marketing channels and campaigns. By focusing on driving conversions, you can ensure that your website is contributing to your bottom line and achieving your business objectives.
Creating Custom Reports and Dashboards
Google Analytics allows you to create custom reports and dashboards to visualize your data in a way that is relevant to your specific needs. Custom reports allow you to combine different metrics and dimensions to create tailored views of your website traffic. Dashboards provide a high-level overview of your key metrics, allowing you to quickly monitor the health of your website and identify any potential problems.
By creating custom reports and dashboards, you can save time and effort by focusing on the data that is most important to you. You can also share your reports with other members of your team, making it easier to collaborate and make data-driven decisions. Setting up these dashboards early on will enable quicker insights as time goes on.
Key Takeaways
- Google Analytics is crucial for understanding website traffic and user behavior.
- Proper setup and configuration are essential for accurate data collection.
- Key metrics like users, sessions, and bounce rate provide valuable insights.
- Segmenting your audience helps tailor marketing efforts to specific groups.
- Analyzing acquisition channels optimizes marketing budget allocation.
- Tracking conversions and goals measures the success of your website.
Frequently Asked Questions
How do I install Google Analytics on my website?
You need to create a Google Analytics account, add your website, and implement the tracking code on every page of your site. Google provides detailed instructions on how to do this.
What is a good bounce rate?
A good bounce rate depends on the type of website, but generally, a bounce rate below 40% is considered good, while a bounce rate above 70% may indicate a problem.
How can I improve my website’s traffic from organic search?
Focus on SEO best practices, such as keyword research, content optimization, and link building. Additionally, ensure your site is mobile-friendly and has fast loading speeds. You can also consult resources such as the Moz SEO Learning Center for more in-depth guidance: Moz SEO Learning Center.
What are segments in Google Analytics?
Segments allow you to divide your website visitors into different groups based on characteristics such as demographics, location, and behavior. This allows for more granular analysis.
Can I track conversions without an e-commerce store?
Yes, you can track conversions for any goal, such as form submissions, downloads, or email sign-ups, by setting up goals in Google Analytics.
Conclusion
Analyzing website traffic using Google Analytics is a critical task for data-driven decision-making. By understanding the key metrics, acquisition channels, and user behavior, you can optimize your website, improve user experience, and drive conversions. Leveraging the tools and techniques in this guide will empower you to effectively analyze your website traffic to achieve your business objectives in 2026. By continuously monitoring and analyzing your data, you will be able to adapt to changing trends and stay ahead of the competition.
Leave a Reply